Use an account’s Transition tab before you move a client into a model. Tilt compares paces side by side: moving everything now, or spreading the move over several years within a tax limit. Each pace shows the tax it costs each year and how close the account gets to the model. Nothing is traded, and the account’s saved model stays the same. The account can belong to a client or to a prospect you are modeling before they join.

1. Choose the model and the paces

Open Clients, choose the client and account, then select Transition. Unrealized gains today at the top shows the account’s gains, net of losses, before any move.
  1. Under Compare with model, choose the model to move into. It starts on the account’s assigned model, when it has one. Choosing another model applies to this comparison only. To change the account’s model, use Setup.
  2. Under Scenarios, set the paces to compare. Each row has a Type, Years, and an Amount where the type needs one.
  3. Select Run.
A new tab starts with four rows: a tax limit over 5 years, a fifth of the gains a year, a third of the gains a year, and moving now. Enter the client’s yearly tax limit in the first row before you run. Add up to 10 rows with Add scenario. Years takes whole years from 1 to 10.
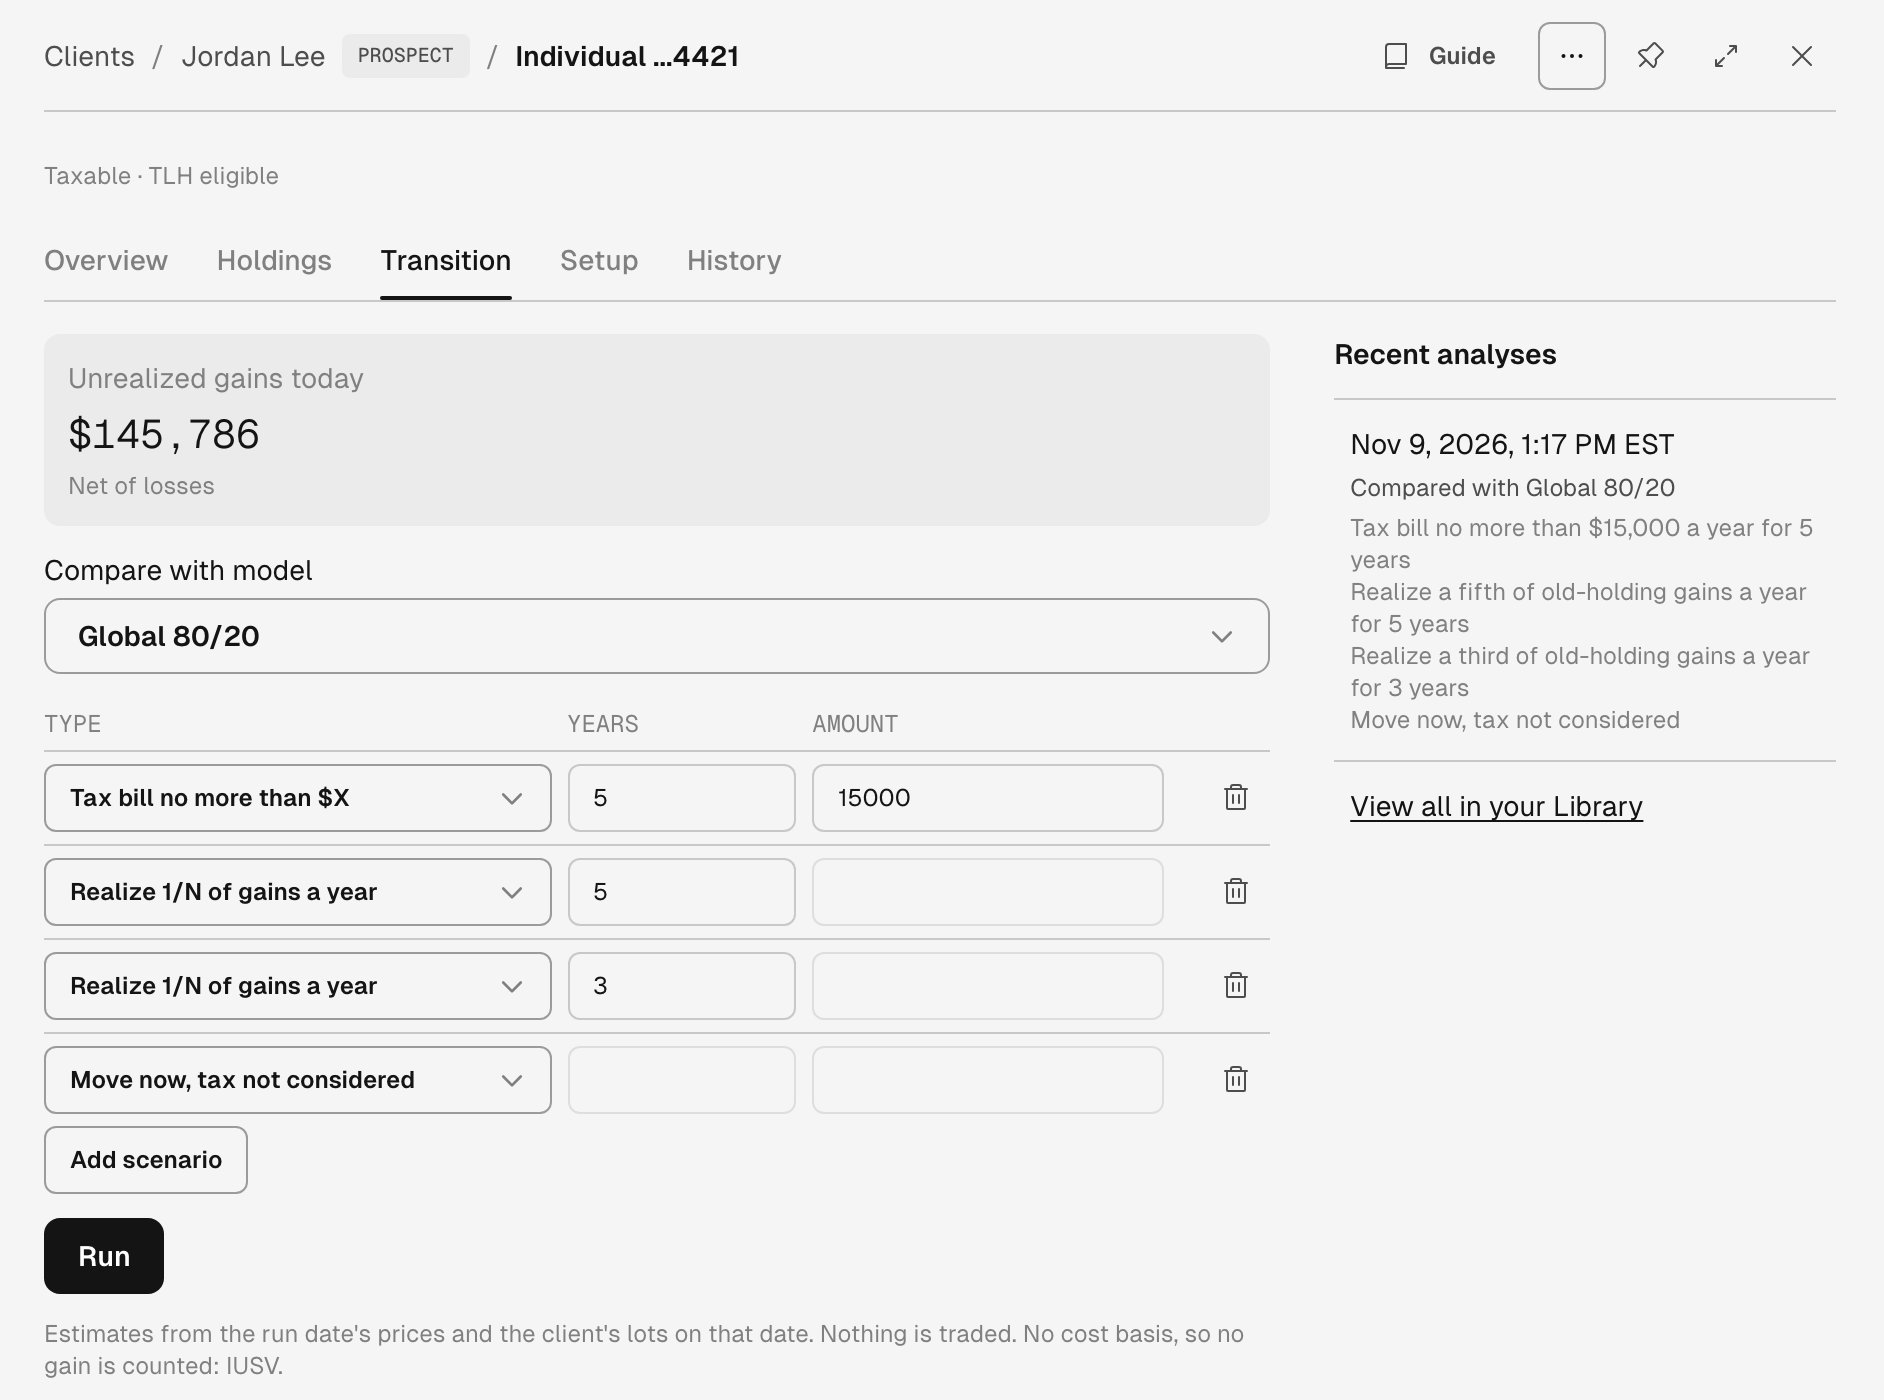
Transition tab for Individual ...4421 showing Unrealized gains today of $145,786, Compare with model set to Global 80/20, four scenario rows with a 15000 tax bill amount in the first, the Run button, and one analysis under Recent analyses.

The prospect Jordan Lee, compared with Global 80/20 at four paces, including a tax bill of no more than $15,000 a year for 5 years.

The run takes a few minutes. You can leave the page. The finished analysis appears at the top of Recent analyses beside the inputs, and in Library under Reports. Select it to open its report.

2. Read the report

The report header names the model and the dates it used: the holdings date and the closing prices of the most recent trading day.

Starting point

The tiles show the account’s value, what it holds outside the model, what it holds in the model at the wrong weight, and its unrealized gains. Show every holding lists each ticker with its value, tax cost basis, unrealized gain, and whether the model holds it. No: to be sold marks a ticker the model doesn’t hold.
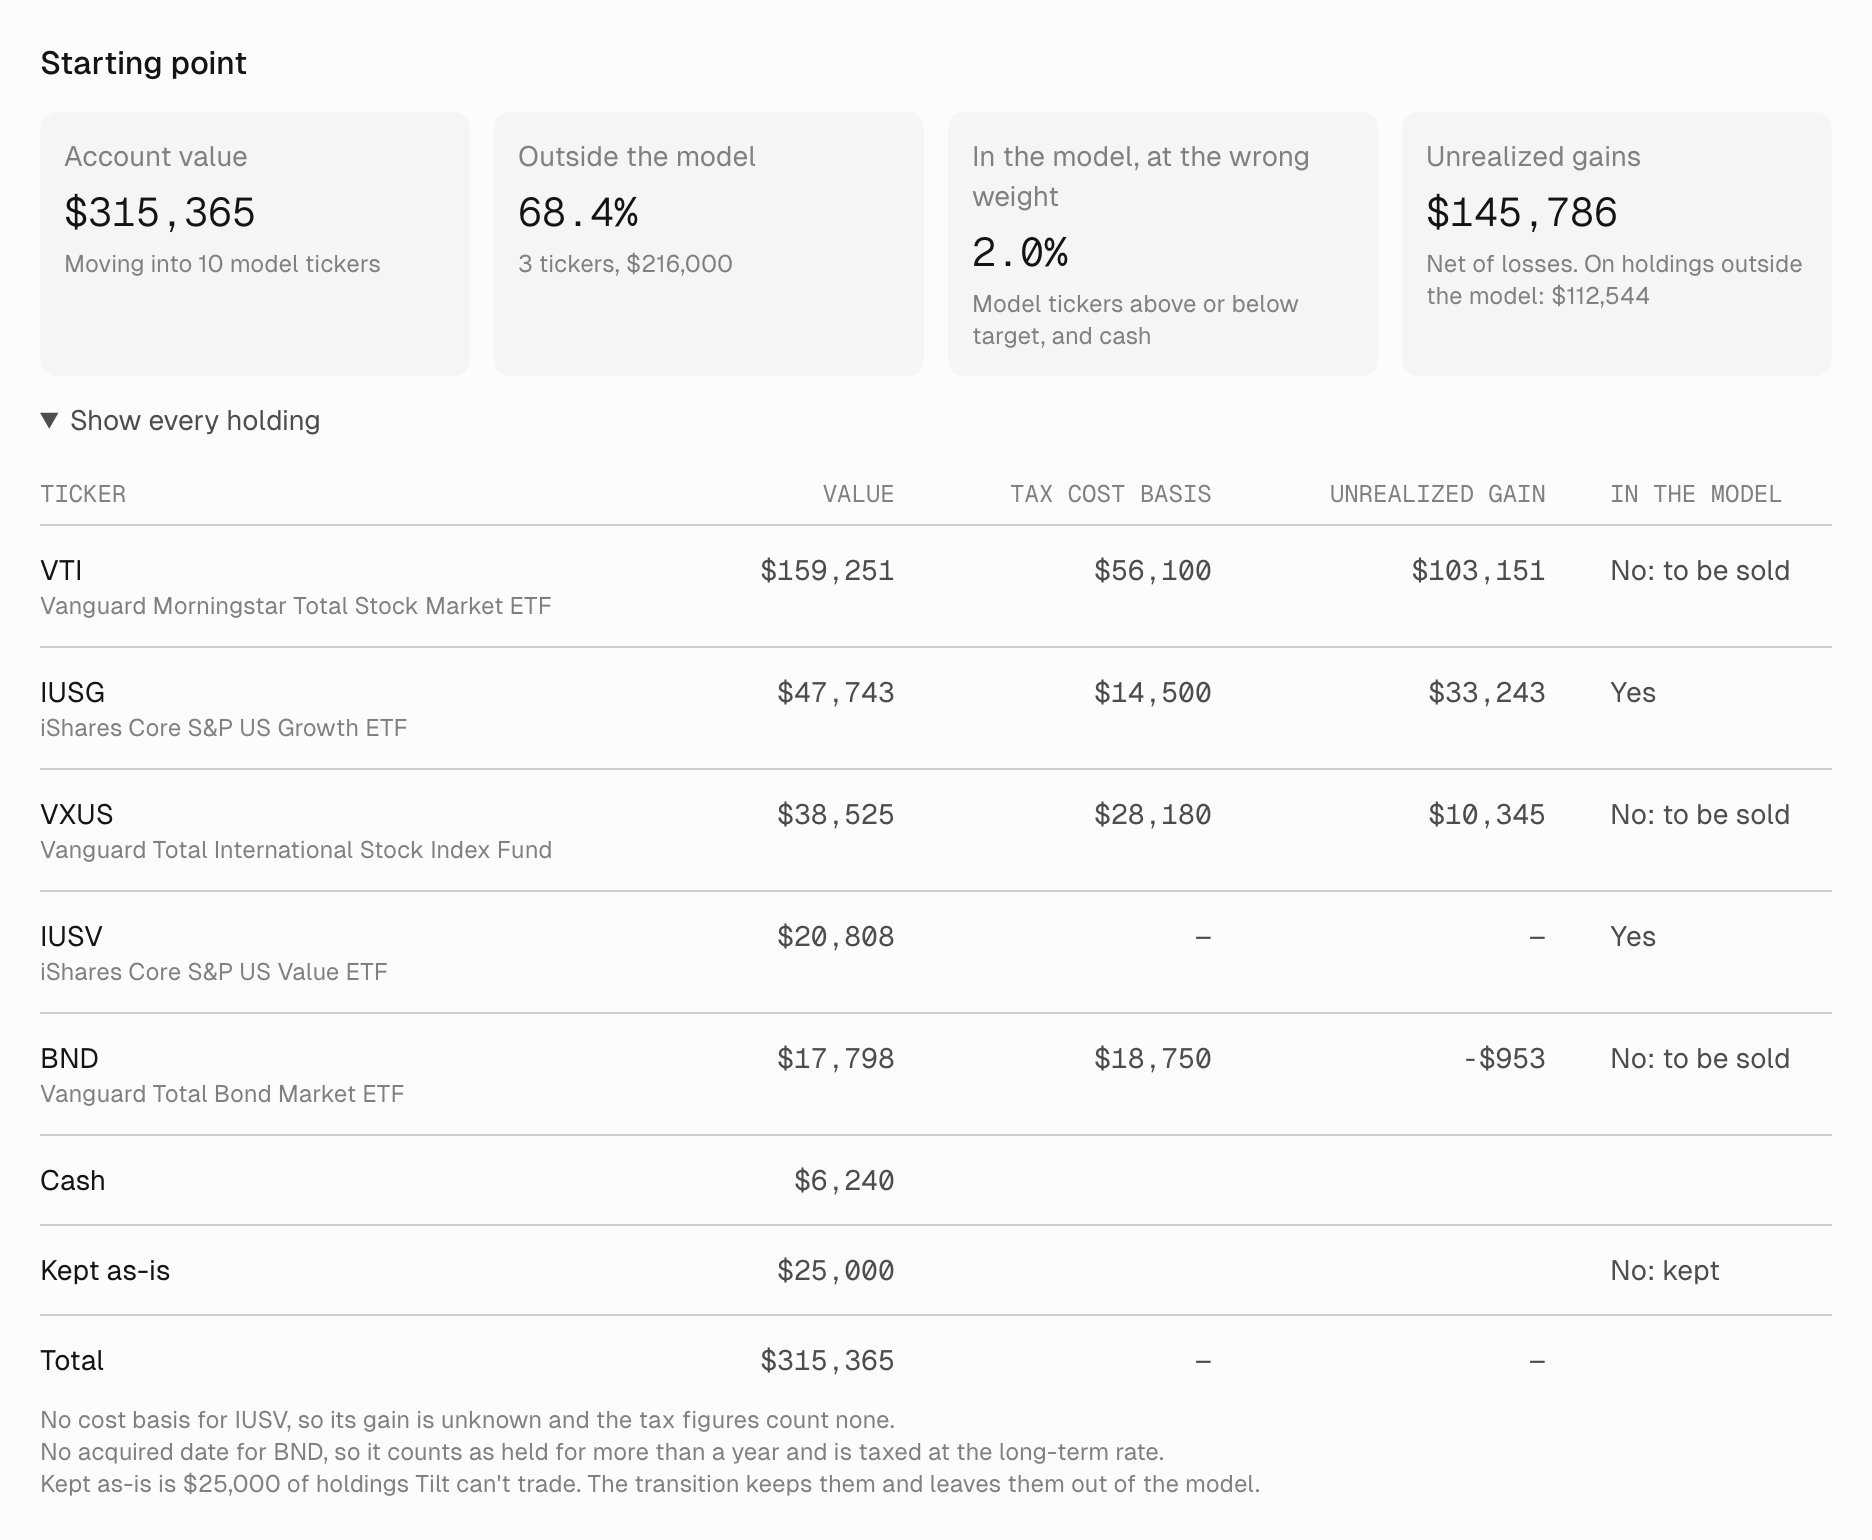
Starting point with tiles for account value $315,365, 68.4% outside the model, 2.0% in the model at the wrong weight, and $145,786 unrealized gains, above a table of VTI, IUSG, VXUS, IUSV, BND, Cash, Kept as-is, and Total, followed by notes on IUSV's missing cost basis, BND's missing acquired date, and the kept-as-is value.

IUSV has no cost basis, so its gain shows as — and the total gain is unknown. The $25,000 private fund is kept as-is.

Check these notes before you share the figures. A missing cost basis makes the tax look lower than it will be.

Compare the paces

Each scenario gets a column. The rows answer the client’s questions: A footnote on a column marks a plan that isn’t finished in the years shown, with an estimate of the tax and years still to go.
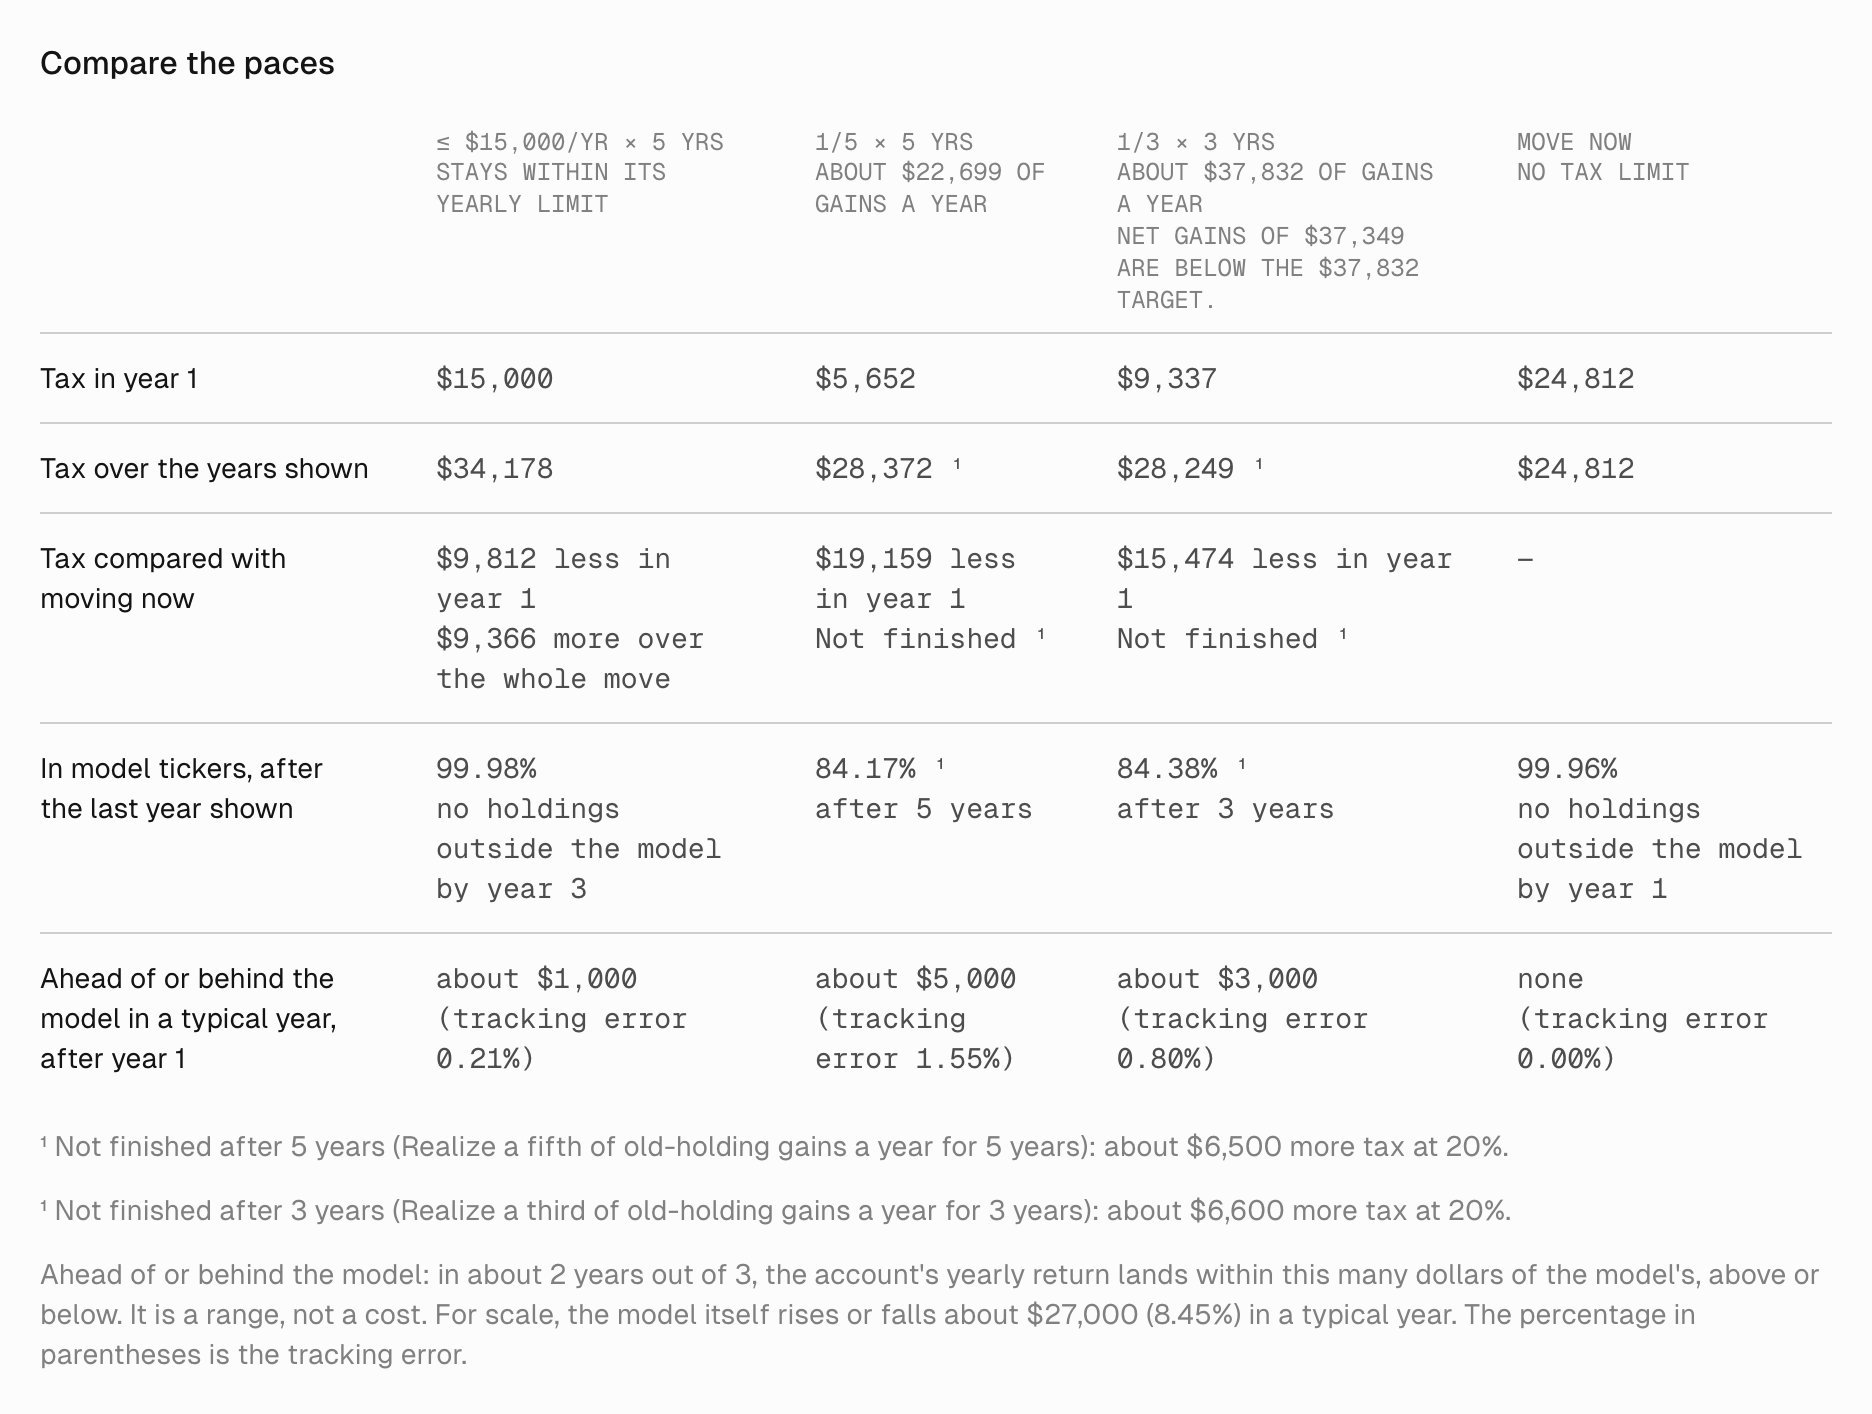
Compare the paces table with columns for a $15,000 yearly tax limit over 5 years, 1/5 over 5 years, 1/3 over 3 years, and Move now, and rows for tax in year 1, tax over the years shown, tax compared with moving now, share in model tickers, and how far ahead of or behind the model the account may be.

The $15,000 limit pays $9,812 less tax than moving now in year 1 and reaches the model by year 3. The two 1/N paces aren't finished in the years shown.

When the account’s tax rates are zero, as for most retirement and education accounts, the report says that no tax applies and every pace matches moving now.

Each scenario, year by year

Choose a scenario to see its plan. In model tickers, Tax so far, and Gains not yet taxed follow the account from Start through each year. Show the full plan and its trades adds the tickers moving in and out, each year’s trades, and every ticker year by year.
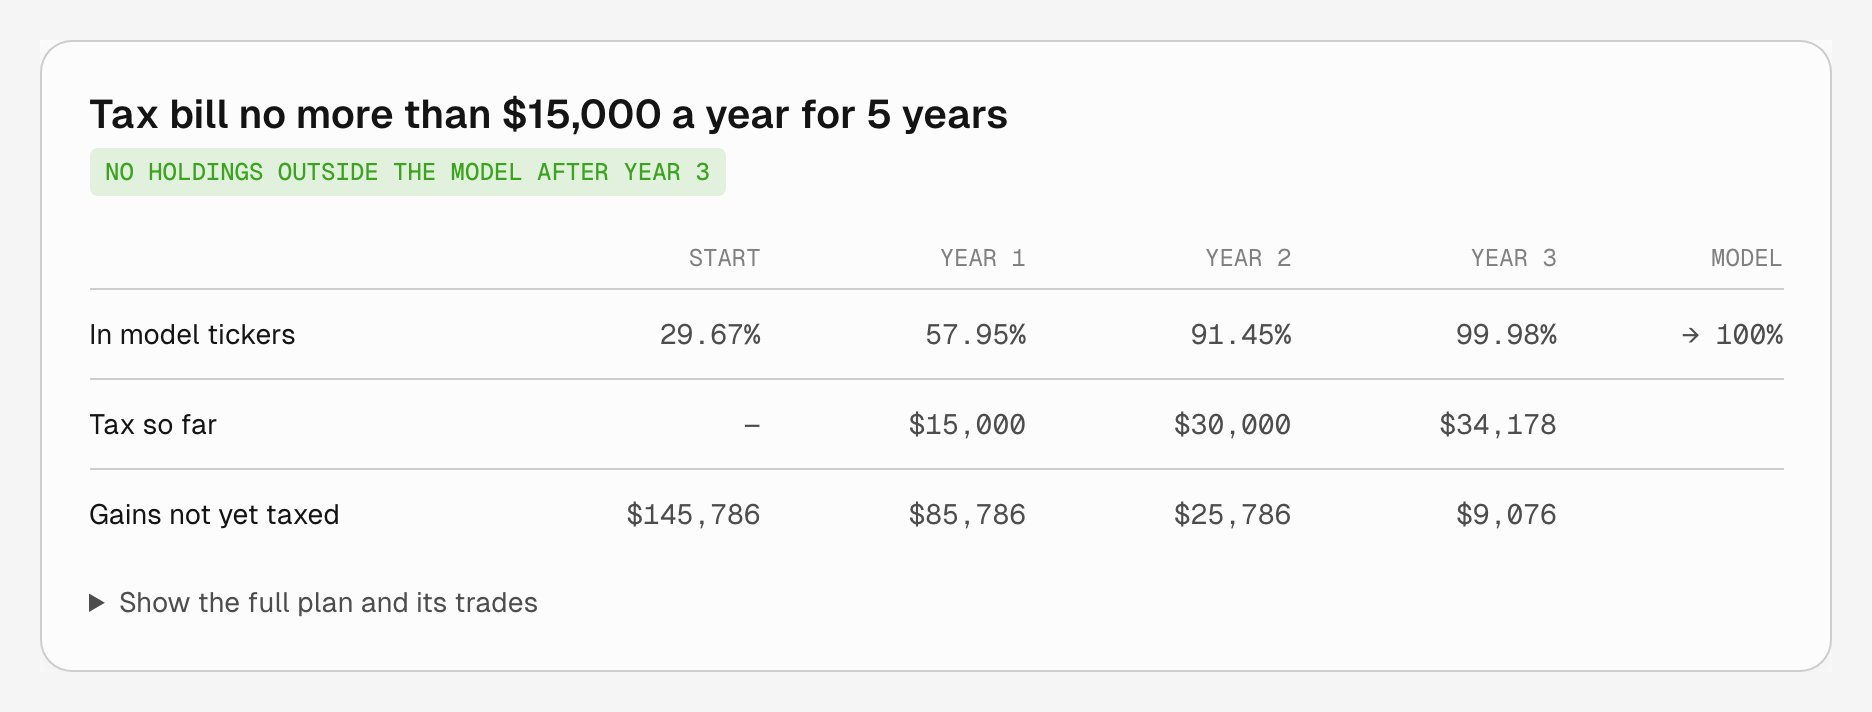
Plan for a tax bill of no more than $15,000 a year for 5 years, marked No holdings outside the model after year 3, with In model tickers rising from 29.67% to 99.98%, Tax so far reaching $34,178, and Gains not yet taxed falling from $145,786 to $9,076.
A plan ends before its last year when there is nothing left to move, or when every holding left outside the model is below 0.1% of the account. The report says which. A plan that ends near the model can still differ from the model’s weights.

Assumptions

The report lists the assumptions behind the estimate:
  • Tilt uses the account’s long-term and short-term tax rates, one of each for every ticker. The 3.8% investment income tax and state tax count only when the account’s rates include them. Set the rates under the account’s tax settings in Setup. See Tax-aware management.
  • Later years use the run date’s prices, so gains don’t grow, and each lot keeps today’s holding period.
  • Tax is paid from outside the account, and sale proceeds are reinvested.
  • Nothing sold at a loss is bought back in a later year.

3. Come back to an analysis

A saved report shows the result as it ran. Changes to the account’s holdings or model after the run don’t update it. To see the effect of new holdings or settings, run the analysis again from the Transition tab. When the client is ready, assign the model in Setup and review a rebalance. To sell a holding down over time inside a sleeve, use Legacy holdings.

Ask Tilt Agent

Ask: “Run a transition analysis for Jordan Lee’s Individual account into Global 80/20. They’ll accept up to $15,000 of tax a year.” Tilt Agent runs the same comparison, saves it as a report, and sums it up in chat with a link to the report.