

Read an account’s performance
Open the client, select the account, and stay on Overview. Performance comes first.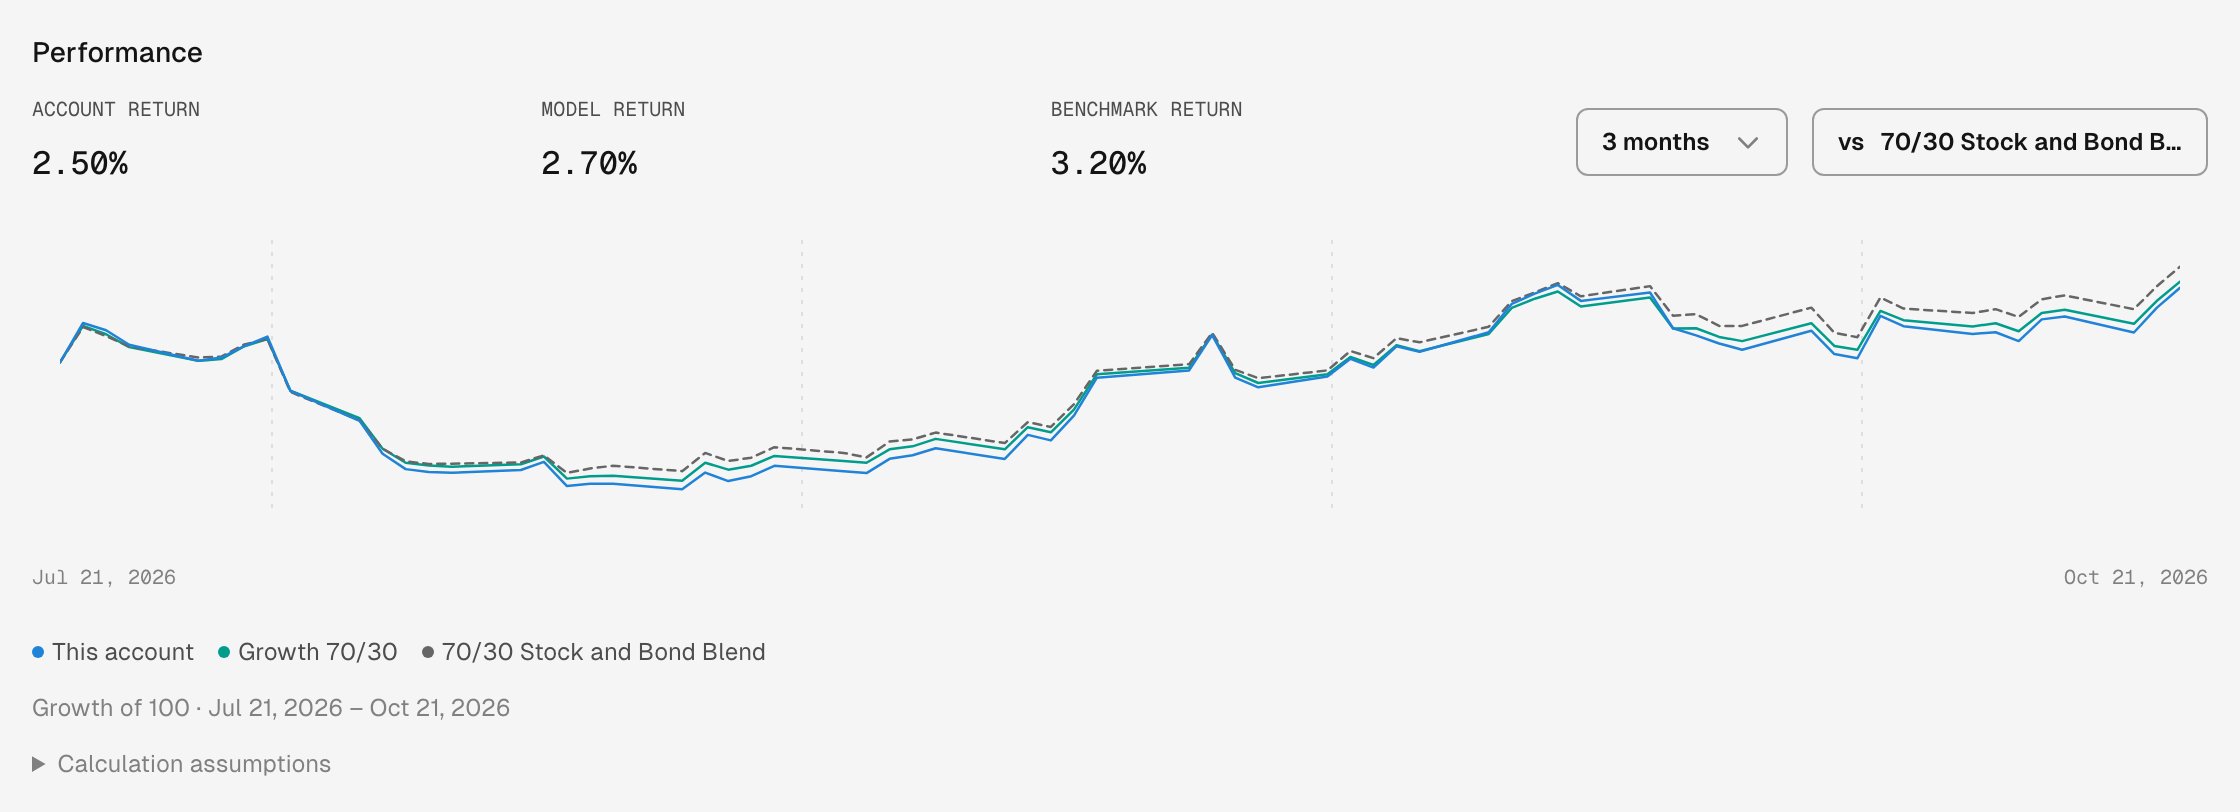
Elena Castellano's Individual account over 3 months, against its model, Growth 70/30, and its own measurement benchmark.
When the account’s daily values begin after the period’s start, the chart starts at its first value and a caption says Since that date. A model or benchmark line that can’t be drawn for the period is left off the chart, with a sentence saying why, such as a missing price.
An account without a model shows Assign a model in Setup to see drift and compare performance with it. with an Open Setup button.
How each line is measured
Calculation assumptions, below the chart, says how the lines are worked out.
The account's Calculation assumptions, opened below the chart.
- The model line shows what today’s targets would have done. It doesn’t show what the account was told to hold at the time, and a model change during the period doesn’t appear.
- The gap between the account and the model also reflects the account’s fees and trading costs and anything it held differently from the model’s targets.
- History starts when the account was linked to its current brokerage. A relinked account starts again from the new link.
When an account has no return
Tilt shows no account return, and says why, when it can’t tell the account’s gains from money moved in or out:Read a household’s performance
Open the household. Performance comes first on Overview, above its members and accounts.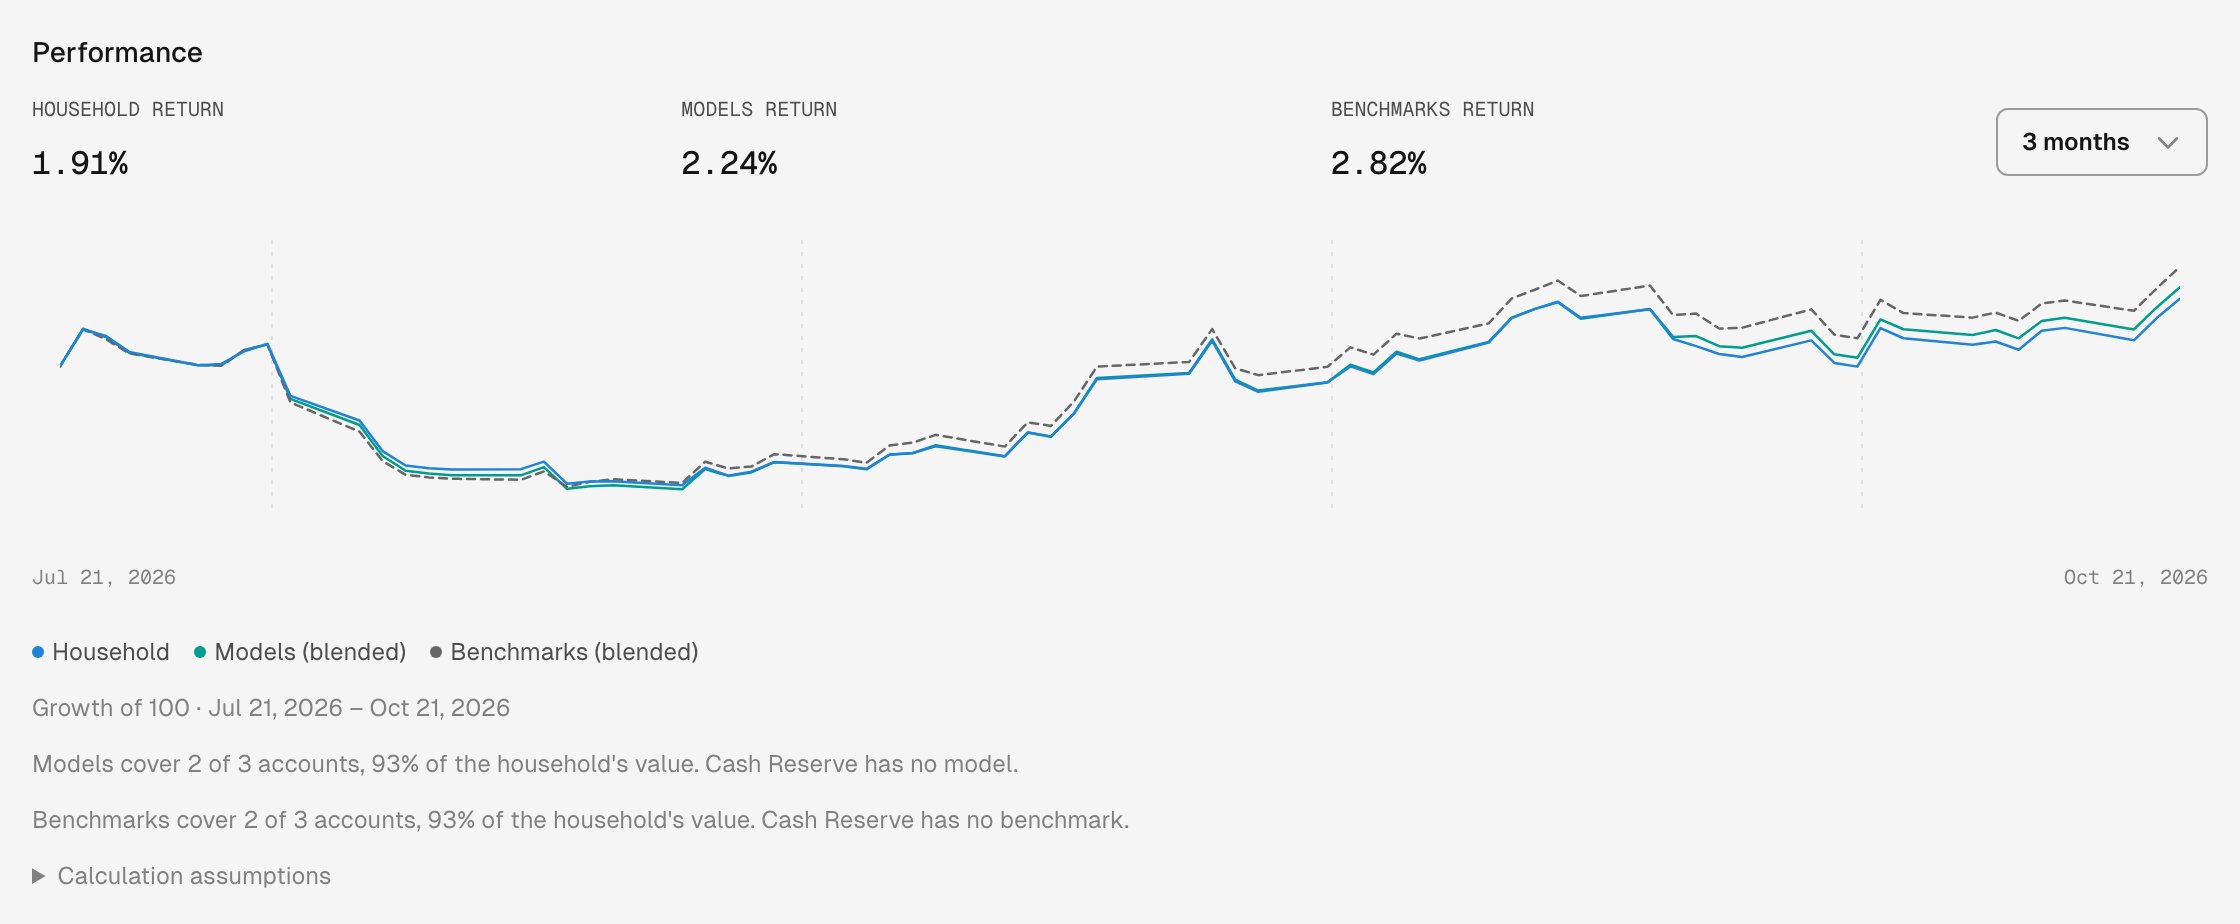
The Castellano Family over 3 months. Cash Reserve has no model and no benchmark, so the blends cover the other two accounts.
A blend leaves out accounts with no model, or no benchmark, and spreads the weight over the rest. When it doesn’t cover every account, a line names the accounts it leaves out and the share of the household’s value it covers, as for Cash Reserve above. Compare the household’s return with a blend only when the blend covers all of it; otherwise compare the covered accounts on their own pages.
Other notes under the chart name:
- an account left out of the household’s return and both blends, with its reason from When an account has no return, such as a brokerage that doesn’t send deposits and withdrawals;
- an account whose values stopped before the chart’s last close, with the date its value is carried forward from.
Ask Tilt Agent
Tilt Agent reads the same figures the page shows. Ask, for example:- “How has my client Elena Castellano’s Individual account done over the last year compared with its model and benchmark?”
- “How has the Castellano household done against its models and benchmarks over 3 months?”
Tilt provides portfolio technology, not investment, tax or legal advice, and is not a registered investment adviser or broker-dealer. Account and household returns come from the values and money moves Tilt receives from each account’s brokerage or custodian.